Products
Solutions
Ecosystems
Resources
Partners
Time Intelligence Metrics in Mosaic: Year-over-Year and Period-to-Date Without the SQL
Every analytics team eventually needs the same set of metrics: revenue this year versus last year, units sold month-to-date, cost quarter-to-date. The question is where those calculations live. In traditional BI architectures, the answer is usually the transformation layer: date dimension tables, SQL joins, schema changes that require a data engineering ticket before an analyst can see the number they need.
The stakes are higher now that AI agents are querying the same data. An analyst can recognize when "last quarter" is ambiguous and ask a follow-up question. An AI agent can't. When a user asks an AI assistant "how did revenue trend last year?" the agent needs a governed definition of what "last year" means and how revenue aggregates within it. Without Time Intelligence Metrics defined in the semantic layer, the agent interprets raw date data on its own, inconsistently, with no guarantee it matches what the dashboard shows. With PreviousYear(Revenue) defined once in Mosaic, every AI query gets the same answer every dashboard does.
Mosaic puts these calculations in the semantic layer, where practitioners define them directly in Mosaic Studio. No SQL required.
What Are Time Intelligence Metrics?
Time Intelligence Metrics are time transformation functions built into Strategy Software's Mosaic that calculate how a metric behaves across time periods. They come in two families:
- Previous Period functions:
PreviousYear, PreviousQuarter, PreviousMonth, PreviousWeek, PreviousDay. These return the value of a metric for a past period relative to the current context. A grid showing monthly sales alongside PreviousYear(Sales) gives you year-over-year in a single metric definition, with no additional SQL.
- Period to Date functions:
YearToDate, QuarterToDate, MonthToDate. These accumulate a metric from the start of the specified period through the current point in time. Add QuarterToDate(Revenue) to a daily sales grid and you get cumulative quarter performance as it builds, day by day.
Both work with base metrics and aggregation metrics using Sum, Count, Min, Max, and Average. One constraint: Average is not supported for Period to Date functions in live mode.
Why Time Attributes Are Mandatory
Before creating any time transformation metric, you need a time attribute. The prerequisite is structural and understanding why makes the rest of the architecture clearer.
A time transformation metric needs a reference axis. PreviousYear(Sales) doesn't know what "year" means unless you tell it which date dimension to traverse. The time attribute provides that reference, defining the hierarchy (year, quarter, month, week, day, and sub-day intervals) that the function walks when calculating the comparison.
Mosaic Studio creates time attributes from any base attribute with a timestamp or datetime data type. The fastest path is the Suggestions panel, which surfaces all timestamp/date attributes in the model and lets you select which intervals to include. You can also create them manually by editing the attribute and selecting intervals from the Time Attributes tab. One detail to know: the 15-minute interval is required if you're creating any time attributes for a given base attribute.
The timetables themselves are generated in the warehouse at first query execution. You don't create them manually.
Mosaic Time Intelligence vs. Transformations in the Schema
In a traditional Mosaic schema setup, time intelligence lives in the transformation layer. You build a date dimension table in the warehouse, join it to your fact tables, and write the period-over-period logic in SQL or dbt. The semantic layer exposes what the transformation produces.
Mosaic Time Intelligence inverts that: the calculation is defined in the semantic layer, and the infrastructure (the time tables) is generated from it. Three practical consequences:
- Adding a new period function requires no schema change. Adding PreviousQuarter to a model that already has PreviousYear is a metric definition in Mosaic Studio, not a schema migration. A practitioner can do it in minutes without touching the warehouse.
- The metric definition and the time hierarchy live in the same place. Changes propagate automatically to every dashboard that uses the metric, without requiring a dbt run or a warehouse job.
- Mosaic time transformation metrics work within the supported aggregation functions. Complex custom SQL time logic that doesn't map to Sum, Count, Min, Max, or Average still belongs in the transformation layer.
The Three Ways to Create Them
Mosaic Studio offers three creation paths, each suited to a different level of familiarity with the function syntax.
- Function Editor is the guided path. Select a function from the Internal functions list (PreviousYear, MonthToDate, etc.), choose the time attribute and the base metric from dropdowns, and the formula assembles itself. For Previous Period functions, you also specify the number of periods back — 1 for the immediately prior period, 2 for two periods back.
Metric Editor is for practitioners who prefer to write the formula directly. The syntax is consistent across functions:
PreviousYear([Order Date (Day interval)], 1, Sales)
PreviousQuarter([Order Date (Day interval)], 1, Sales)
QuarterToDate([order_date], Max(unit_price))
Type the formula, validate it, name the metric, and save.
- Auto Metric is the AI-assisted path. Describe what you want in natural language, like "Create a time transformation metric for previous month units sold,” and Mosaic generates the formula. Review it, click Create, and save. Useful when you know what you want but haven't memorized the function signatures.
What a Time Intelligence Dashboard Looks Like
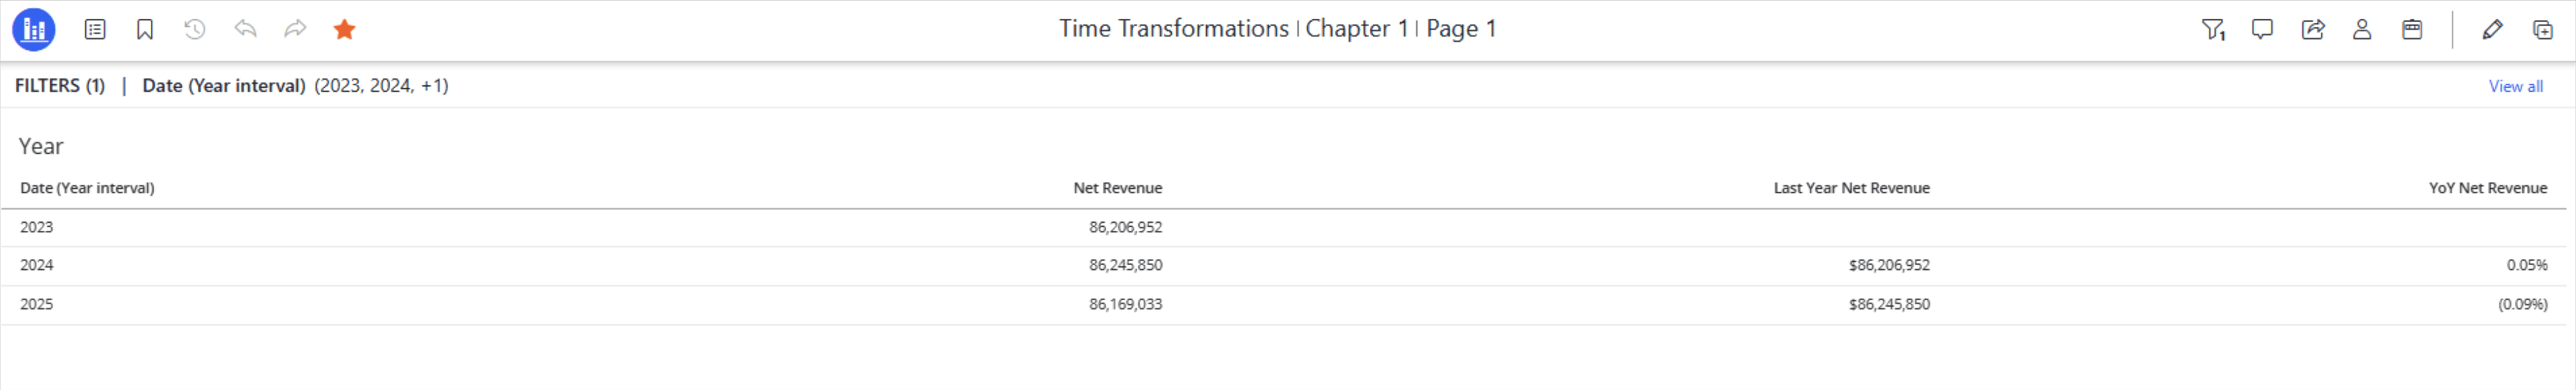
In practice, Time Intelligence Metrics work best when placed alongside the base metric on a time-series grid. A dashboard with Sales (current), PreviousYear(Sales), and YearToDate(Sales) on a monthly axis gives an analyst three views of performance, current period, same period last year, and cumulative, in a single visualization, each driven by a single metric definition in the model.
Limitations Worth Knowing Before You Build
Time transformation metrics handle most standard reporting patterns cleanly. The constraints worth flagging before scoping dashboard work:
- Subtotals and grand totals on Period to Date metrics return null. Plan dashboard layouts accordingly. Don't rely on row or column totals for YTD or QTD metrics.
- Count distinct and smart metrics are not supported by either function family.
- Period to Date metrics don't support dataset-level filters or simultaneous filters across two or more-time hierarchies.
- Time transformation metrics cannot be created across models in a linked model. The time attribute and the metric must live in the same model.
- Pair time transformation metrics with time interval attributes on visualizations (e.g., "order_date (Day interval)"), not with the base date attribute. Using the base attribute produces unexpected results.
Frequently Asked Questions
Q: What are Time Intelligence Metrics in Mosaic?
A: Time Intelligence Metrics are time transformation functions in Strategy Software's Mosaic that calculate period-over-period comparisons and period-to-date aggregations at the semantic layer. Previous Period functions (PreviousYear, PreviousQuarter, PreviousMonth, PreviousWeek, PreviousDay) return a metric's value for a past period. Period to Date functions (YearToDate, QuarterToDate, MonthToDate) accumulate a metric from the start of a period through the current point in time.
Q: Why do I need a time attribute before creating a time transformation metric?
A: Strategy Mosaic requires a time attribute because time transformation functions need a date dimension to reference. Without it, functions like PreviousYear have no axis to traverse when calculating the prior-period value. The time attribute defines the hierarchy (year, quarter, month, week, day) the function uses, and Mosaic generates the underlying timetables in the warehouse automatically at first query execution.
Q: What's the difference between Previous Period and Period to Date functions?
A: Previous Period functions return the value of a metric for a specified past period relative to the current row context — useful for year-over-year, month-over-month comparisons. Period to Date functions accumulate a metric from the start of a period through the current point in time — useful for tracking cumulative performance within a quarter or year as it progresses. Both function families are available in Strategy Software's Mosaic: Previous Period since December 2025, Period to Date since March 2026.
Q: Can I use time transformation metrics in linked Mosaic models?
A: Partially. Strategy Software's Mosaic supports time transformation metrics in linked models, but you cannot create the metric across model boundaries — the time attribute and the metric definition must exist within the same model. Existing Previous Period metrics brought in from individual models continue to work for standard aggregations (Sum, Count, Average, Max) after linking.
Q: How does Mosaic time intelligence differ from building date dimensions in the warehouse?
A: In a traditional setup, time intelligence requires building date dimension tables in the warehouse and writing period logic in SQL, work that involves data engineering and schema changes. Strategy Software's Mosaic Time Intelligence defines the calculation at the semantic layer instead. Adding a new period function is a metric definition in Mosaic Studio, not a schema migration, and the time tables are generated automatically. The tradeoff: Mosaic time transformation metrics are limited to supported aggregation functions (Sum, Count, Min, Max, Avg), so complex custom SQL time logic still belongs in the transformation layer.
Build Your First Time Intelligence Metric
The documentation covers prerequisites, time attribute creation, all three metric creation methods, and the full list of supported functions and limitations.
_(1).png&w=750&q=75)
Igor Freitas
Igor Freitas is a Product Manager at Strategy Software, leading Strategy Mosaic. With 20+ years of data and analytics experience, he specializes in semantic layers, AI solutions, and data modeling. Igor also creates The Strategist Corner, sharing insights on modern architecture.
Related posts
Learn how Mosaic Model Linking enables governed analytics across multiple data sources without merging data or duplicating business logic. Discover how semantic-layer federation connects models, preserves security, and simplifies cross-domain reporting for AI and BI.
_(2).png&w=750&q=75)
David Cheng
June 1, 2026
Semantic layers for AI go beyond metadata — they enforce business logic before any model touches the data. See how Strategy Mosaic eliminates AI inconsistency and cuts LLM token costs by up to 50%.

Lauren O’Connor
May 27, 2026

Enterprise AI adoption is a data governance question before it is a model question. Strategy Software on what a room of CIOs got right at the IDC Summit.
Lauren O’Connor
May 20, 2026
Learn how a semantic layer differs from a data model and why both are essential for governed analytics and AI. Discover how Strategy Mosaic creates consistent business definitions, reusable metrics, and trusted AI-ready data across BI tools, warehouses, and enterprise systems.
.png&w=750&q=75)
Emily Murphy
May 20, 2026